

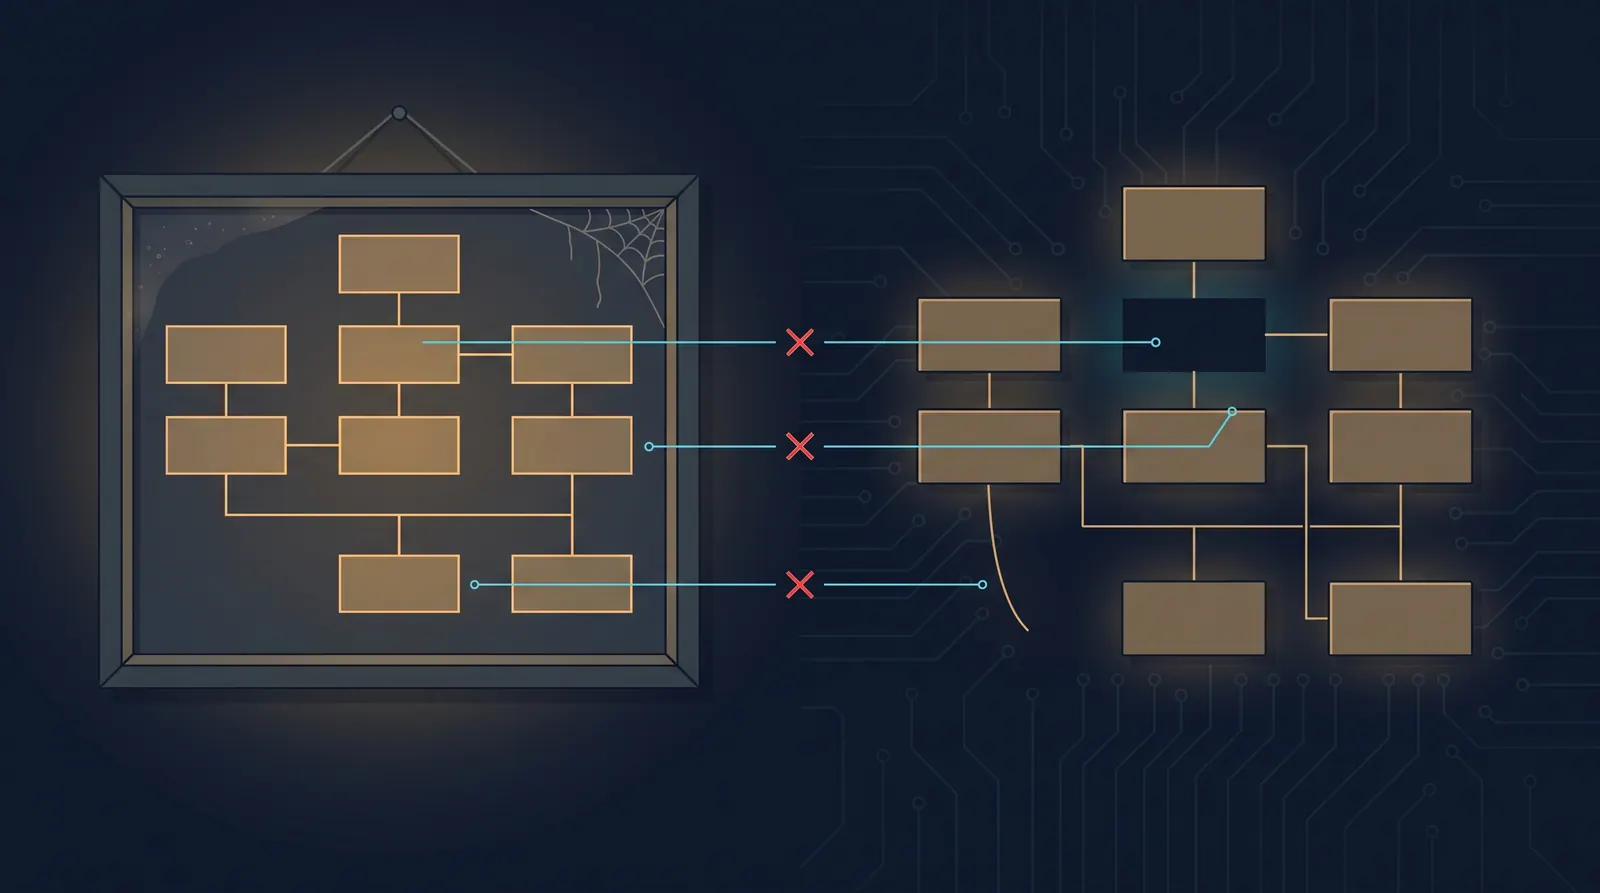
Wire a diagramming tool to your editor through a tool server and the workflow gets genuinely pleasant. Describe an architecture in a sentence, get a diagram back, and — the part worth noticing — get it as an editable file rather than a picture.
Two minutes of configuration, and the cost of producing a diagram drops to roughly zero.
Which moves the problem. Diagrams were never scarce because they were hard to draw. They were scarce because they were hard to keep true, and nothing about generating them faster touches that.
Three formats, and what each one costs at review time
Whatever produces it, a diagram lands in your repository in one of three shapes, and the choice decides everything downstream.
| Shape | Diffable | Editable later | Renders where |
|---|---|---|---|
| Raster or exported image | No | No | Everywhere |
| Text-defined (Mermaid, D2, Graphviz) | Yes, readably | Yes | Only with a renderer |
Tool-native file (.drawio XML) | Technically | Yes, in that tool | Only in that tool |
The middle column matters more than it looks. A diagram arriving in a pull request as an image cannot be reviewed — you see the new picture, not what changed about it. The reviewer’s only option is to hold both versions in their head, which nobody does, so image diagrams get approved unread.
Text-defined diagrams diff like code, which is the whole argument for them. Tool-native XML diffs in the technical sense and not in the useful one: a line moved four pixels and a semantic change look identical, because both are coordinate churn.
That is the same standard as any other generated artefact. A change nobody can review is not cheaper, it is just unchecked, and diagrams get an exemption they have not earned.
Check that yours actually render
A small trap, and this site has been sitting on it.
A fenced ```mermaid block only becomes a picture if something in the pipeline turns it into one. There is no such step here: mermaid is installed, but it is imported by a single interactive component, not by the Markdown pipeline, and the built pages carry no mermaid markup or script at all.
So a mermaid fence in an article body ships as a code block. For our three articles about Mermaid that is correct and deliberate — they are teaching the syntax, and the syntax is the subject. For one other article it appears to be an accident: two fences that read like they were meant to be drawn.
Nothing failed. The build was green, the page rendered, the block appeared. The diagram simply was not there, and only reading the published page reveals it. Worth ten minutes on your own site before you generate anything.
The part tooling does not touch
Here is what makes diagrams different from the rest of your documentation, and why cheap generation is a mixed blessing.
A diagram is an assertion about how the system works. This service calls that one. This queue sits between them. This path is synchronous.
Every one of those is checkable in principle and checked in practice by nobody. Prose that goes stale reads as stale — the tone dates it, the names it uses have changed. A diagram does not age visibly. A box diagram from 2023 looks exactly as authoritative as one drawn this morning, and it is the thing new joiners trust most because it is the fastest thing to absorb.
Generation makes this worse in a specific way. The model produces a diagram from your description, so it depicts what you said, which is your mental model rather than the system. If your mental model was already out of date, you now have a confident illustration of a system that does not exist, and it looks like evidence.
Some diagrams are supposed to go stale
A distinction the advice usually skips, and it flips the guidance.
A diagram in an incident write-up describes the system as it was during the incident. It should never be updated. Editing it later to match the current architecture destroys the only thing it was for, which was explaining why something failed under conditions that no longer exist. Same for a design document arguing a decision: it records the state the decision was taken in.
A diagram in a service README is the opposite. Its entire value is that it matches today, and the day it stops matching it becomes actively harmful, because it is the first thing a new joiner believes.
So before drawing, decide which kind it is, and label it. Snapshots get a date and are frozen. Living diagrams get an owner and a place in the change that would invalidate them. The failure everyone has met is a living diagram treated as a snapshot: nobody updates it, nobody removes it, and it quietly becomes the most confident wrong thing in the repository.
What actually keeps a diagram honest
Nothing here needs tooling. All of it needs a decision about where the diagram lives.
Draw the smallest thing that answers a question. A diagram of the whole platform answers nothing and is wrong within a month. A diagram of one request path answers one question and stays true longer, because fewer things can move under it.
Put it next to what it describes. In the README of the service it depicts, not in a wiki three clicks away. Proximity is the only thing that makes updating it feel obligatory during a change.
Prefer the diffable format. Even where it renders as nothing, a text-defined diagram is readable at review as text — a reviewer can see that an edge was added. That is a lower bar than rendering and a higher one than an image.
Generate from the system where you can. A dependency graph produced from actual imports or actual traces cannot be stale, because it is derived rather than asserted. This is a much smaller category than people hope, and inside that category it is the only version that stays true without discipline.
Date the ones you cannot generate. “Accurate as of the payments migration” costs a line and tells a reader how much to trust it. It is not a substitute for updating; it is an honest label while you have not.
What to ask before you generate one
Two questions, and both are about later.
Who will notice when this becomes wrong? If there is no answer, the diagram will be wrong and still on display. Consider not drawing it.
Can a reviewer see what changed? If the answer is no, the format is the problem, and picking a different one costs nothing today and quite a lot in six months.
The tooling is good and the editable output is the right instinct — a file you can adjust beats a picture you must redraw. Just be clear about what it bought. It made drawing cheap. Keeping a diagram true was always the expensive half, and it still is.