
In Part 1 we covered what Mermaid is and why it matters. Part 2 went deep on flowcharts and sequence diagrams. This final article tackles the third major diagram type — Gantt charts — and wraps up with the practical tips that make Mermaid work well in real projects.
Gantt charts aren’t something most developers think about daily, but they show up constantly in sprint planning, project proposals, and release schedules. Being able to generate one from 20 lines of text instead of wrestling with a project management tool is genuinely useful.
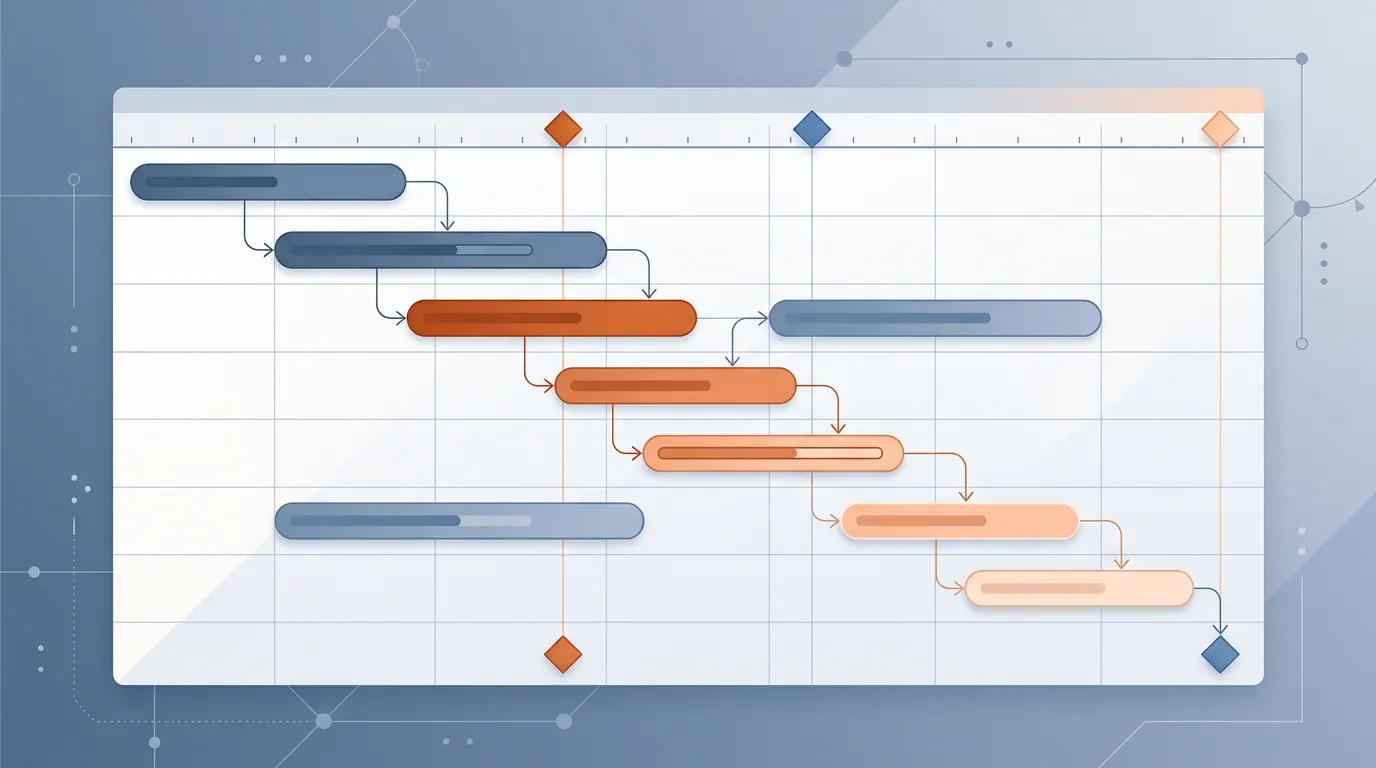
Gantt chart fundamentals
A Gantt chart in Mermaid starts with the gantt keyword, followed by metadata and task definitions.
gantt
    title Project Name
    dateFormat YYYY-MM-DD
    axisFormat %d.%m

    section Section Name
    Task name    :taskId, start_date, duration
Key elements:
title— the chart headingdateFormat— how Mermaid should parse your dates (usuallyYYYY-MM-DD)axisFormat— how dates appear on the horizontal axis (%d.%m,%b %d, etc.)section— groups related tasks visually- Tasks follow the pattern:
Name :modifiers, id, start, duration
Duration units: d (days), w (weeks), h (hours).
Dependencies: Use after taskId instead of a start date to chain tasks.
Task modifiers:
| Modifier | Effect |
|---|---|
done | Marks the task as completed (filled/greyed) |
active | Marks the task as in progress (highlighted) |
crit | Marks the task as critical path (red/emphasized) |
milestone | Zero-duration marker — a point in time, not a range |
Level 1: A basic project plan
The simplest Gantt chart is a sequence of tasks with dependencies.
```mermaid
gantt
    title Landing Page Redesign
    dateFormat YYYY-MM-DD

    section Design
    Competitor analysis       :a1, 2026-03-10, 3d
    Create mockups            :a2, after a1, 5d
    Design approval           :a3, after a2, 2d

    section Development
    Frontend build            :a4, after a3, 7d
    Testing                   :a5, after a4, 3d

    section Launch
    Deploy                    :a6, after a5, 1d
```
Each task depends on the previous one via after. Sections create visual grouping. This is enough for small projects or proposals where you just need to show the timeline.
Level 2: Parallel work and task statuses
Real projects have parallel workstreams. The backend team doesn’t wait for frontend mockups, and QA starts preparing test plans before development finishes.
```mermaid
gantt
    title Mobile App Development
    dateFormat YYYY-MM-DD
    axisFormat %d.%m

    section Planning
    Requirements gathering      :done, req, 2026-03-02, 5d
    Technical specification     :done, spec, after req, 4d
    Architecture review         :done, review, after spec, 2d

    section UI/UX Design
    Wireframes                  :done, wire, after review, 5d
    UI Kit                      :done, uikit, after wire, 4d
    Figma prototype             :active, proto, after uikit, 6d

    section Backend
    Infrastructure setup        :done, infra, after review, 3d
    Auth API                    :done, auth_api, after infra, 5d
    Business logic API          :active, biz_api, after auth_api, 8d
    WebSocket service           :ws, after auth_api, 6d

    section Frontend Mobile
    Base navigation             :active, nav, after proto, 5d
    Login screen                :login_screen, after nav, 4d
    Main screen                 :main_screen, after nav, 6d
    User profile                :profile, after login_screen, 3d

    section QA
    Test plan                   :testplan, after biz_api, 3d
    Functional testing          :functest, after testplan, 7d
    Regression                  :regress, after functest, 3d

    section Release
    Beta release                :milestone, beta, after regress, 0d
    Collect feedback            :feedback, after beta, 5d
    Final release               :milestone, release, after feedback, 0d
```
Several things to notice:
donemarks completed tasks. They render with a different fill so you can see progress at a glance.activehighlights tasks currently in progress. In a real sprint, you’d update these as work moves forward.milestonetasks have zero duration (0d). They appear as diamond markers on the timeline — useful for beta releases, code freezes, and go-live dates.- Backend and UI/UX Design run in parallel after the architecture review. Neither blocks the other.
- Cross-section dependencies tie the project together. QA starts its test plan after
biz_apifinishes, not after design.
Level 3: A product roadmap with critical path
For larger projects spanning months, you’ll want the critical path highlighted, weekends excluded from calculations, and multiple milestone checkpoints.
```mermaid
gantt
    title SaaS Platform — Q1-Q2 2026 Roadmap
    dateFormat YYYY-MM-DD
    axisFormat %b %d
    excludes weekends

    section Discovery
    Market research                 :done, market, 2026-01-05, 10d
    User interviews                 :done, interviews, 2026-01-05, 12d
    Competitive analysis            :done, compet, after market, 5d
    Product Requirements Document   :done, prd, after interviews, 5d
    Strategy session                :done, milestone, strategy, after prd, 0d

    section Design Sprint
    User Story Mapping              :done, usm, after strategy, 3d
    Information Architecture        :done, ia, after usm, 4d
    Low-fidelity wireframes         :done, lowfi, after ia, 5d
    High-fidelity mockups           :active, hifi, after lowfi, 8d
    Design System update            :active, ds, after lowfi, 6d
    Usability testing               :usability, after hifi, 5d
    Design Freeze                   :crit, milestone, dfreeze, after usability, 0d

    section Backend Engineering
    Database schema migration       :crit, dbmigr, after strategy, 5d
    Auth microservice v2            :crit, authv2, after dbmigr, 10d
    Payment integration Stripe      :crit, stripe, after authv2, 8d
    Notification engine             :notif, after authv2, 7d
    Search service Elasticsearch    :search, after dbmigr, 12d
    API Gateway refactoring         :apigw, after authv2, 6d
    Rate limiting and throttling    :ratelim, after apigw, 4d
    Backend API Freeze              :crit, milestone, apifreeze, after stripe, 0d

    section Frontend Engineering
    Component library update        :complib, after ds, 6d
    Dashboard redesign              :dashboard, after dfreeze, 10d
    Billing and subscription UI     :billing_ui, after stripe, 7d
    Notification center UI          :notif_ui, after notif, 5d
    Search UI                       :search_ui, after search, 5d
    Responsive and a11y audit       :a11y, after dashboard, 4d
    Frontend Freeze                 :milestone, fefreeze, after a11y, 0d

    section Quality Assurance
    Test automation framework       :testfw, after apifreeze, 5d
    Integration testing             :crit, inttest, after testfw, 8d
    Performance and load testing    :perftest, after inttest, 5d
    Security audit                  :crit, secaudit, after inttest, 7d
    UAT                             :crit, uat, after perftest, 5d
    QA Sign-off                     :crit, milestone, qasign, after uat, 0d

    section DevOps
    Kubernetes cluster upgrade      :k8s, after strategy, 5d
    CI/CD pipeline optimization     :cicd, after k8s, 4d
    Monitoring and alerting         :monitoring, after cicd, 5d
    Disaster recovery drill         :dr, after monitoring, 3d
    Infrastructure ready            :milestone, infraready, after dr, 0d

    section Launch
    Staged rollout                  :crit, rollout, after qasign, 10d
    Full GA release                 :crit, milestone, ga, after rollout, 0d
    Post-launch monitoring          :postmon, after ga, 10d
    Retrospective                   :retro, after postmon, 2d
```
This is closer to what a real product team would use. Key features at play:
excludes weekendsautomatically skips Saturdays and Sundays when calculating durations. A 10-day task actually spans two calendar weeks.critmarks the critical path — the chain of tasks where any delay pushes the entire release date. Here it runs through database migration, auth service, payment integration, QA, and the staged rollout.- Multiple milestones serve as checkpoints: strategy session, design freeze, API freeze, QA sign-off, GA release.
- Six sections represent different teams or workstreams, all with cross-dependencies.
When to use which diagram
After three articles, here’s the practical decision guide:
| Situation | Diagram type | Why |
|---|---|---|
| Process flow, algorithm, decision tree | Flowchart | Shows the logic path and branching |
| System architecture, service topology | Flowchart with subgraphs | Groups services into layers |
| API interaction, auth flow, request chain | Sequence diagram | Shows who calls whom and when |
| Debugging “what calls what” | Sequence diagram | Time-ordered participant interactions |
| Sprint plan, project timeline | Gantt chart | Shows duration, dependencies, progress |
| Product roadmap, release schedule | Gantt chart with milestones | Shows critical path and checkpoints |
| Data model, class relationships | Class diagram (not covered here) | Shows structure, not behavior |
| State machine, lifecycle | State diagram (not covered here) | Shows transitions between states |
Advanced tips
These tips apply to all Mermaid diagram types and come from real experience using them in documentation.
Keep diagrams focused
A diagram that tries to show everything shows nothing well. If your flowchart has 30+ nodes, split it. Show the high-level architecture in one diagram, then drill into each subsystem in separate diagrams. Readers can follow a clear 10-node diagram. They can’t follow a 40-node one.
Use the Live Editor for prototyping
The Mermaid Live Editor gives you instant rendering as you type. It’s the fastest way to iterate on diagram syntax before committing it to your docs. You can also export diagrams as SVG or PNG if you need standalone images.
Theme selection matters
The default theme works for most cases, but consider:
forestfor a softer green palettedarkfor dark-themed docsneutralfor minimal stylingbasefor maximum customization
Apply a theme at the top of your diagram:
%%{init: {'theme': 'neutral'}}%%Handle special characters properly
If your labels contain parentheses, commas, or colons, wrap them in double quotes:
A["Step 1: Initialize (required)"] --> B["Process, transform, validate"]Without quotes, Mermaid will try to parse the parentheses as shape syntax and the diagram will break.
Clickable links in flowcharts
Flowchart nodes can link to URLs:
click A "https://docs.example.com" "Open documentation"This works in the Mermaid Live Editor and some platforms. GitHub renders them but doesn’t make them clickable for security reasons.
Interactive playground
Try editing the Gantt chart code below, or switch to a different diagram type.
Useful resources
- Mermaid official docs — the full reference
- Flowchart syntax — all shapes, arrows, and subgraph options
- Sequence diagram syntax — participants, messages, blocks
- Gantt chart syntax — tasks, dependencies, modifiers
- Mermaid Live Editor — instant prototyping and export
Wrapping up the series
Across these three articles, we’ve gone from “what is Mermaid?” to building production-grade diagrams for architecture documentation, API flows, and project planning. The core value stays the same: diagrams that live next to your code, get reviewed in PRs, and stay current because they’re easy to update.
If you take one thing away from this series, it’s that the best documentation isn’t the most beautiful — it’s the documentation that actually gets maintained. Text-based diagrams lower the bar for maintenance enough that people actually do it.
Start with the next process you need to document. Write it as a Mermaid diagram instead of drawing it. See how it feels. You’ll probably keep going.
TL;DR
Gantt chart essentials:
- Tasks with
after taskIdfor dependencies done,active,critfor task statusesmilestonefor zero-duration checkpointsexcludes weekendsfor realistic scheduling
When to use what:
- Flowcharts for processes and architecture
- Sequence diagrams for API/service interactions over time
- Gantt charts for project timelines and roadmaps
Best practices:
- Keep diagrams focused (10-15 nodes max per diagram)
- Prototype in the Mermaid Live Editor
- Don’t hardcode colors; use themes instead
- Wrap labels with special characters in double quotes