
Recently, my life has changed: I started studying pentesting, and my main goal has become the ability to both attack and defend computer systems and applications. From taking the OWASP Top 10 course from Sviatoslav Loginov to completing real-world tasks during the three-month training program, this journey has been rich and instructive.
Visualizing Network Reconnaissance with Nmap and DrawNmap
Introduction
In the field of cybersecurity, network mapping and reconnaissance are foundational techniques for identifying potential attack surfaces and understanding infrastructure. One of the most trusted tools for this purpose is Nmap (Network Mapper) – a powerful open-source utility for network discovery and security auditing.
However, Nmap’s raw output, particularly in large or complex networks, can become difficult to interpret at a glance. That’s where DrawNmap, a Python-based visualization tool, becomes invaluable.
This article walks you through how to use Nmap for network scanning and how to leverage DrawNmap to convert scan results into intuitive, actionable visualizations.
Why Use Nmap?
Nmap is widely used in offensive and defensive security for:
- Port scanning (TCP/UDP)
- OS and service fingerprinting
- Identifying live hosts
- Network inventory and vulnerability assessments
Example use cases:
- Penetration testers looking to map out potential entry points
- Blue teams validating network configurations
- SOC analysts checking for unauthorized hosts or rogue services
The Problem with Raw Nmap Output
Nmap supports multiple output formats: normal (-oN), grepable (-oG), and XML (-oX). While XML is the most structured, parsing it manually or reviewing large results can be time-consuming and error-prone.
For instance, scanning a subnet of 256 IPs with service detection can result in thousands of lines of XML. This is not ideal for:
- Rapid visual inspection
- Executive reporting
- Spotting anomalies in complex topologies
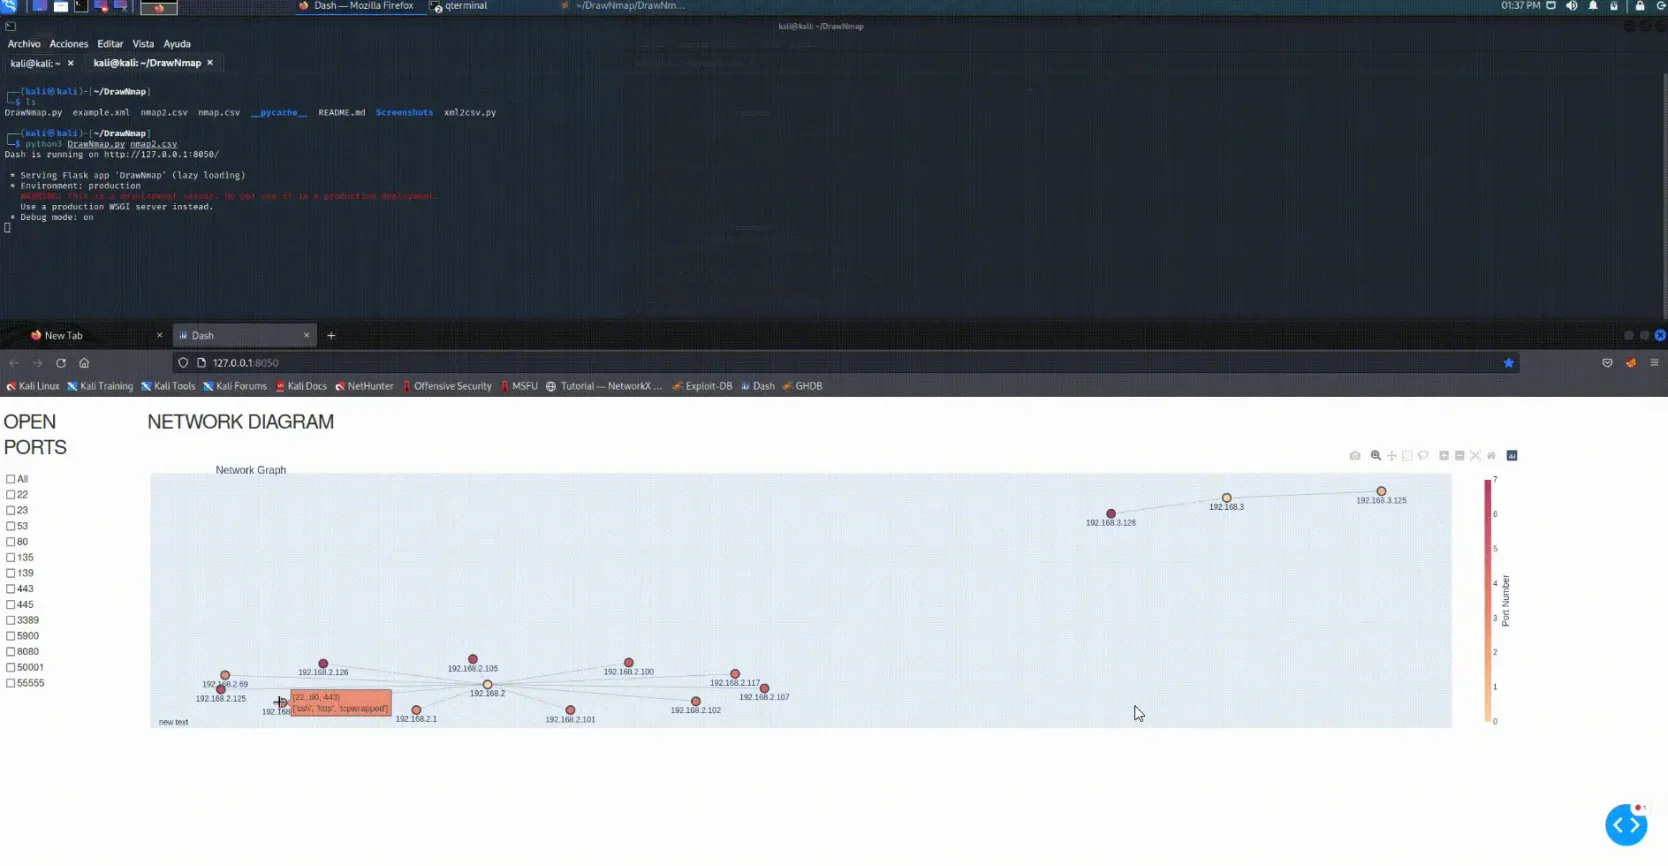
What is DrawNmap?
DrawNmap is an open-source tool developed by jor6PS that transforms Nmap XML output into visually interpretable graphs. These graphs help visualize network structure, host relationships, and exposed services.
Key features:
- Parses
nmap -oXXML output - Generates
.pngor.svgnetwork diagrams - Uses NetworkX and Matplotlib for layout rendering
- Supports filtering, port grouping, and layout customization
Installation
git clone https://github.com/jor6PS/DrawNmap.git
cd DrawNmap
pip install -r requirements.txt
Ensure you have Python 3 and the following dependencies:
- networkx
- matplotlib
- lxml
How to Use DrawNmap with Nmap
Step 1: Perform an Nmap scan with XML output
nmap -sS -sV -O -T4 -oX scan.xml 192.168.1.0/24-sS: SYN scan-sV: Detect service versions-O: Attempt OS detection-T4: Faster execution-oX scan.xml: Save output in XML format
Step 2: Visualize with DrawNmap
python3 DrawNmap.py -f scan.xml -o network_map.pngOptional parameters:
--layout circular|shell|spring|kamada_kawai--output-format svg|png
Example:
python3 DrawNmap.py -f scan.xml -o topology.svg --layout spring
Use Cases in Cybersecurity
1. Network Reconnaissance (Red Team)
Visual maps make it easier to:
- Identify critical assets
- Spot exposed management ports (e.g., SSH, RDP)
- Plan lateral movement paths
2. Network Auditing (Blue Team)
- Verify that only authorized services are running
- Detect inconsistencies (e.g., workstations running FTP servers)
- Report on network structure to non-technical stakeholders
3. Documentation & Reporting
- Integrate graphs into pentest reports
- Use in executive summaries to communicate risk visually
4. Continuous Security Monitoring
- Automate periodic scans and visual exports
- Integrate into CI/CD pipelines for DevSecOps
Benefits of Visualization
- 🔍 Quick Pattern Recognition: See which hosts are hubs or have too many open ports
- 🚩 Anomaly Detection: Spot unusual services or rogue devices visually
- 📊 Better Communication: Replace raw data with intuitive maps
Limitations
- Only supports XML output from Nmap
- Very large scans (>1000 hosts) may generate cluttered graphs
- Does not analyze vulnerabilities – visualizes structure only
- May require fine-tuning layout for clarity
Pro Tip: Automate the Workflow
You can script the entire flow for regular scans:
#!/bin/bash
nmap -sS -sV -O -T4 -oX /tmp/scan.xml 192.168.1.0/24
python3 /opt/DrawNmap/DrawNmap.py -f /tmp/scan.xml -o /var/www/html/nmap_report.svg
Then access the SVG report in a browser or send via email.
Conclusion
Combining Nmap’s powerful scanning capabilities with DrawNmap’s intuitive visualizations enables security professionals to:
- Accelerate network reconnaissance
- Simplify reporting
- Identify weak points faster
Whether you’re conducting a red team engagement or auditing your internal infrastructure, DrawNmap offers a fresh and effective way to understand your network visually.