

Product teams have spent two decades learning to design for two audiences: end users, who need to accomplish something, and developers, who need to build with your thing. Both are humans, and both get studied the same way: map the journey, find where people get frustrated, fix that.
There is a third audience now, and it arrived without anyone updating the method. An agent reads your documentation, decides whether your API fits the task, obtains credentials, calls your endpoints, and reports back — usually with no human watching any individual step.
The interesting part is not that the audience is new. It is that the instrument every journey map depends on stops working, and what replaces it is better.
The sentiment curve is gone
A user journey map is a path with feelings drawn along it. Curious at discovery, hopeful at evaluation, frustrated during setup, relieved at first success. That curve is the entire diagnostic value of the artefact — you look for the dip and you go fix the dip.
An agent has no such curve. It is not frustrated by a confusing error message; it either recovers or it does not. It is not delighted by a clean API; it either completes the call or it does not. There is no dip to look for because there is no feeling to dip.
What you have instead, at every stage, is a rate. Out of a hundred agents attempting this step, how many get through? That is a reliability curve, and it differs from a sentiment curve in a way that matters a great deal:
| Human journey | Agent journey | |
|---|---|---|
| What you plot | Sentiment | Success rate |
| How you gather it | Interviews, surveys, observation | Instrumentation, replay, counting |
| What a low point means | People feel bad here | Attempts fail here |
| Confidence in the number | Small samples, self-reported | Large samples, directly measured |
| Can you regression-test it | Not really | Yes |
The last row is the one to notice. Nobody has ever been able to put a user journey map in CI. An agent journey map is a hundred scripted attempts and a pass rate per stage, which is a test suite wearing different clothes.
So the honest way to read the whole “agent experience” idea is not as a new design discipline. It is the first journey map that can be measured rather than inferred, and QA already owns the tooling for that.
The five stages, and where the rate actually drops
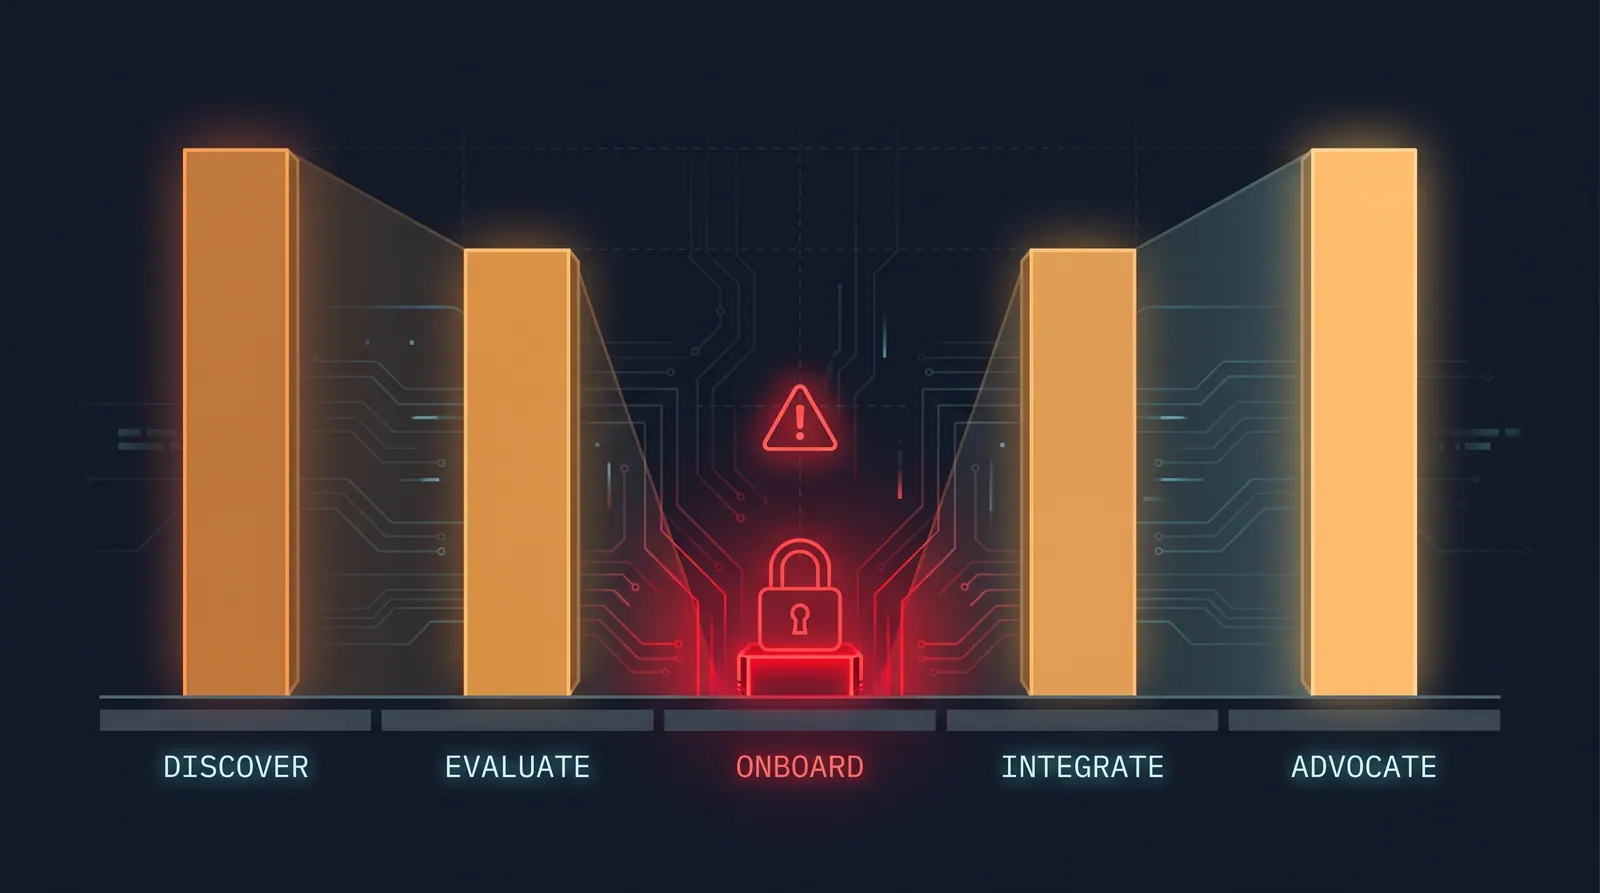
The path an agent takes maps onto the familiar adoption funnel with the same shape and different failure modes.
Discover. Can the agent find you at all? This is where the entire consulting industry currently lives, and it is the stage with the least evidence behind it. There are agencies selling visibility in model training data, and there is a family of acronyms for optimising toward model citations. What there is not, so far, is a published result showing any of it works. Treat this stage as genuinely unsolved and spend accordingly, which is to say cautiously.
Evaluate. Can the agent tell whether you fit? This is documentation quality, which you were supposed to be doing anyway. The proposed conventions here have had a rough time: a standardised file for describing your site to models has seen little traffic in practice, with at least one detailed writeup finding that the bots it was designed for do not look for it. Plain Markdown versions of your docs get requested more, which suggests the winning move is boring — make your existing documentation available in a format that parses cleanly, rather than adopting a new manifest.
Onboard. Can the agent get set up without a human? This is where the rate actually collapses, and it is the stage with the clearest, most fixable problem. Authentication flows are built around a human clicking an approval screen. An agent hits that screen and stops. Everything downstream of it, meaning your API, your clean errors and your generous rate limits, is unreachable, and the pass rate for the entire journey is capped by this one step.
Integrate. Can the agent operate you reliably once it is in? Error messages become the interface. A human reading 400 Bad Request opens your docs; an agent reading it retries the same call. An error that names the field, the constraint, and the corrected shape is the difference between a recovery and a loop.
Advocate. Does the agent choose you again, and does it recommend you? Largely downstream of the other four, and not worth optimising directly.
Errors are your interface now
Worth pulling out, because it is the highest-yield change available and it costs nothing but attention.
For a human, an error message is a signpost. It says something went wrong, and the human goes and figures it out using context you did not provide. For an agent, the error message is the context. It has your documentation only if it fetched it, and it has your intent never. Whatever recovery information exists must be in the response.
Compare what an agent can do with:
{ "error": "Invalid request" }against:
{
  "error": "invalid_parameter",
  "parameter": "start_date",
  "problem": "format must be YYYY-MM-DD, received '03/14/2026'",
  "retryable": true
}
The second one is machine-recoverable. The first produces a retry of the identical call, then another, then a give-up — and in your logs it looks like an agent that could not use your API, when it is actually an agent you did not tell.
Three properties to aim for, in order of value: say which input was wrong, say what shape was expected, and say whether retrying could ever help. That third one prevents the most expensive failure mode, which is an agent burning turns and tokens retrying something structurally impossible.
What to measure
The reason to take the reliability framing seriously is that it turns vague “make it agent-friendly” work into a list of numbers with owners.
- Instrument per stage. Requests from agent user-agents, grouped by funnel step. You want to see where the count drops, not what the total is.
- Watch the auth step hardest. If your onboarding requires a browser redirect and a click, your ceiling is set there regardless of everything else. Machine-obtainable credentials, scoped narrowly, move this number more than any other change.
- Count retry storms. Repeated identical calls from one session is your error-message quality metric, and it is sitting in logs you already have.
- Replay a fixed set. Fifty scripted tasks against your API, run on a schedule, pass rate reported. This is the regression suite for the whole map, and it is the part that makes the difference between a grade and a measurement.
Point four is the one that turns this from a design exercise into engineering. A journey map you re-draw quarterly is a poster. A journey map that runs nightly and tells you a stage regressed is infrastructure.
The uncomfortable part
The discovery stage has the most vendors and the least evidence, and the onboarding stage has the least glamour and the most measurable upside. That asymmetry is worth naming plainly, because attention flows the other way.
Nobody is going to sell you a package for fixing your OAuth flow so a machine can complete it, or for rewriting four hundred error responses to name the offending field. Both of those move a number you can watch. The visibility work may also matter eventually, and right now it is a bet placed without a scoreboard.
Start where the rate drops. For almost everyone, that is authentication, and it has been sitting there the whole time looking like a security decision rather than an adoption one.